Coding Challenge 1: Hosting
A new portfolio page was created on GitHub and two charts have been displayed for this coding challenge.
Coding Challenge 2: Building
Visualizations have been created for this coding challenge. Three different charts have been created and they have been displayed.
Coding Challenge 3:Debating
Debating Inequality in the UK
Gini coefficient indicator depicts income inequality. Chart A shows that the trend has larely remained stable since 2008. But there has been a slight increase in the Gini coeefficient for all individuals(1.9 points) and retired individuals(3.9 points) in a ten year period from 2011/12 to 2021/22. Chart B shows that UK's Gini coefficient is one of the highest among the OECD countries and requires policy intervention.
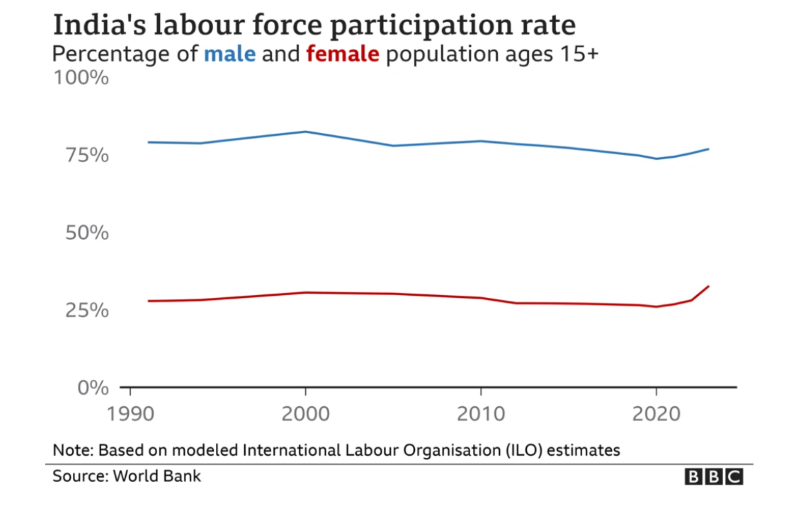
Coding Challenge 4: Replication
India's labour force particpation rate - male and female for 15 years+ has been depicted showing the wide disparity between the two in a BBC article titled - "India's economy: The good, bad and ugly in six charts". It can be observed here that while the chart depicts the two labour force participation rates (male & female) in a simple line chart the quantum of difference is not clear.
Coding Challenge 5: Scraper
India's Digital Payment Revolution - Unified Payments Interface
Unified Payments Interface (UPI) is an instant payment system developed in India that powers multiple bank accounts into a single mobile application interface facilitating inter-bank peer-to-peer (P2P) and person-to-merchant (P2M) transactions. It's usage has exploded in recent years driven by increased smartphone usage and internet penetration. The data for this has been scraped from the Wikipedia page on Unified Payments Interface. The python code used for scraping is here - Google Colab Scraping Notebook.
Coding Challenge 6: Loops Dashboard
UK Economy Gross Value Added Timeseries Dashboard
This dashboard dynamically loads nine charts using Vega-Lite specifications on various timeseries data on UK economy's gross value added in different sectors. The data for this has been sourced from ONS . The notebook used for looping the ONS API in python is here - Google Colab Loops Notebook.
Coding Challenge 7: Maps
Child Mortality Rates in India
Under-five mortality (U5MR) is defined as the number of deaths per 1000 live births for children less than 5 years old. Chart A shows the base map of India with the states. Using data from the National Family Health Survey 4 (2019-20), Chart B shows the wide variations in under-five mortality rates across different states with southern states like Kerala having lower mortality rates while northern states such as Uttar Pradesh and Bihar having above national average mortality requiring greater focus and policy intervention.
Coding Challenge 8: Big Data
Analyzing UK Prices - Cheap Flavoured Milk and Volatile Rice
In the first chart, analysis of monthly price trends for Milk products was done using data from Davies and McElvoy (2024). This chart shows the price evolution of four types of milk by calculating a price index relative to the starting pricein Britain over a year.
Data for milk products were filtered and grouped by month and results were plotted by visualizing trends with a line chart to highlight changes over time.
Flavoured milk turns out be cheaper over time comapred to other types of milk!
In the second chart, rice which is a staple part of the diet, shows sudden increased price volatility after January 24, 2024 and remains so throughout 2024 except for one major drop in volatility for two weeks in March. What is so special for the threshold of January 24, 2024?
The notebook used for filtering and transforming the data in python is here - Google Colab Big Data Notebook.
Coding Challenge 9: Analytics Chart
Analysing India's Child Malutrition and Impact of Numerous Indicators on Child Mortality
Analytical Framework: In the 1st chart, in order to analyse the relationship between child malnutrition variables and access to improved sanitation, we refer to NFHS - 5 (2019-21) data state wise to create bubble correlation charts (population adjusted) and conduct coorelation analysis between the two. In the 2nd chart, a trellis chart containing 4 regression charts with independent x-axes and regression lines for the regression of under-five mortality rate on different indicators has been created. The notebook used for reducing, collapsing and grouping the data in python is here - Google Colab Project Notebook.
Coding Challenge 10: Interactive Visualisations
Journey of India's Rupee & No 'Runaway' Public Debt except for Japan
The 1st interactive chart is related to India's currency exchange rate system. The rupee was pegged to the dollar. In 1991, India faced a balance of payment crisis and was forced to sharply devalue its currency currency leading to floating exchange regime determined by the market and intervention by the central bank only in cases of extreme volatility. The Indian rupee has gradually depreciated since the global recession in 2008 with another sharp depreciation in 2020 -21 during Covid-19.
In 2nd interactive chart, public debt of six countries are depicted. In the last thirty years, except for Japan, other countries have seen their debt to GDP ratios increase in a 'manageable' way.The python code used for melting the data is here - Google Colab Scraping Notebook